Client-go 中的label selector 引起的 CPU Throttling问题
前序
Kubernetes是目前最流行的容器编排工具之一,提供了丰富的功能,用于管理和部署容器应用程序。在Kubernetes中,使用client-go来与Kubernetes API进行交互。client-go提供了简单易用的API,帮助用户轻松操作Kubernetes集群。然而,在使用client-go时,我们也需要注意性能方面的问题。具体来说,client-go中的cache ListAll() 函数可能会触发CPU密集型操作。本文记录了我们如何排查和解决了tlb-service-contrller的CPU Throttling问题,旨在为同行提供思考和借鉴的经验。
最近,我作为eBay内部Cloud网络团队的值班人员, 日常工作是处理团队维护的各种 Kubernetes的控制器(controller的)和服务的健康状态的实时警报。当出现故障、性能问题或安全问题时,立即响应并采取必要的措施来解决问题。在最近的值班中,我接到关于公司内部 tlb-service-controller 的告警电话,快速查看后发现问题是 CPU Throttling 导致 tlb-service-controller 重启。以下是对问题的排查过程和解决方案的记录。在这篇文章中,我将分享我处理这一技术挑战的经验和所得的教训,以便给同行提供有益的思考和指导。
CPU Throttling 问题排查
收到告警电话,扩容CPU
10-->20-->40 CPU 扩容的过程
当我接到告警电话☎️时,发现当前 tlb-service-controller 的 CPU 限制设置为 10。最初认为是由于 controller 需要协调的对象太多,导致其无法正常工作。为了暂时解决问题,我将 CPU 限制从 10 增加到 20。然而,即使增加到 20,依然存在CPU Throttling的情况,于是我将 CPU 再次增加到 40。这样 tlb-service-controller 的 CPU 使用率稳定下来,上下游用户暂时不受影响。接下来,我将查找导致当前问题的原因
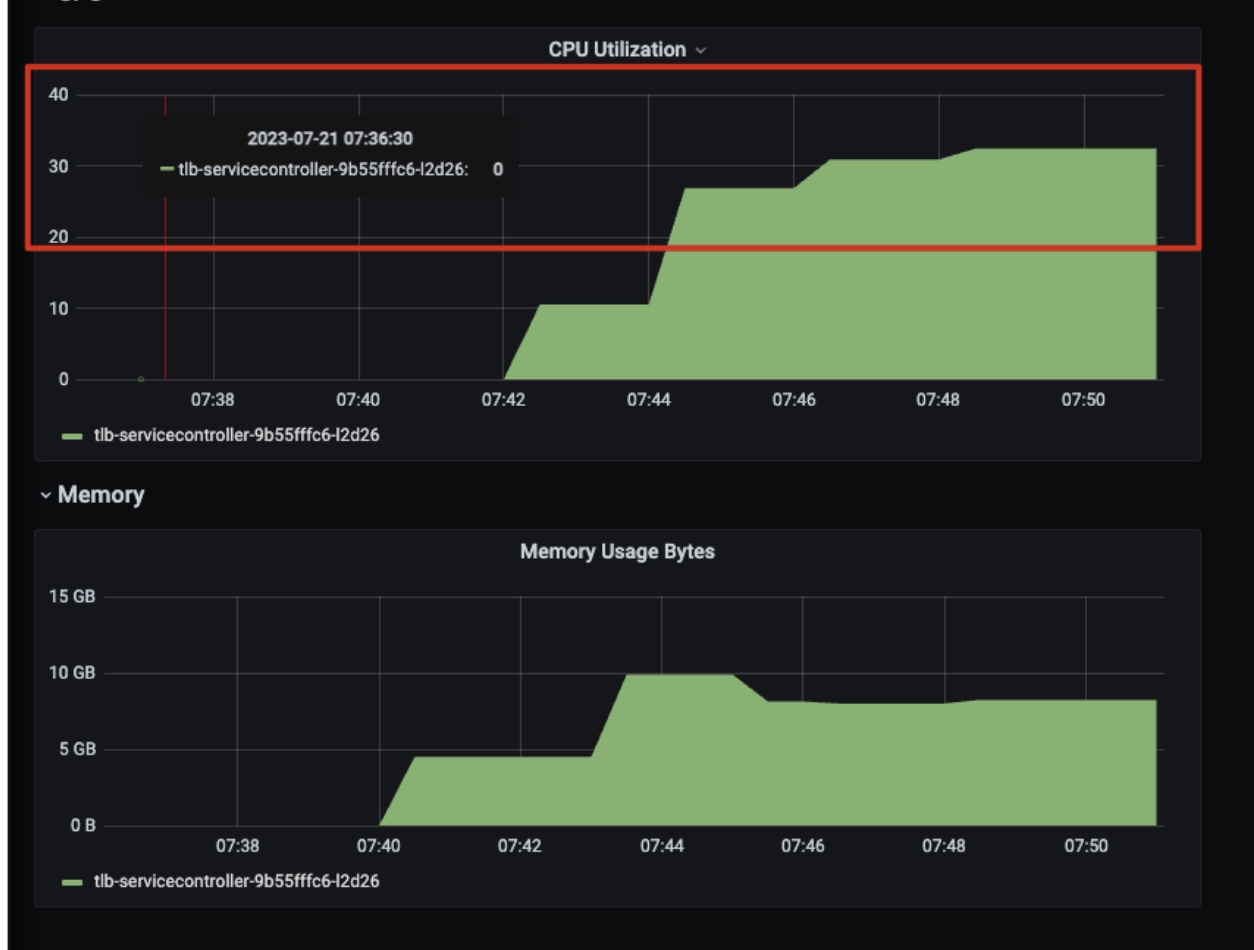
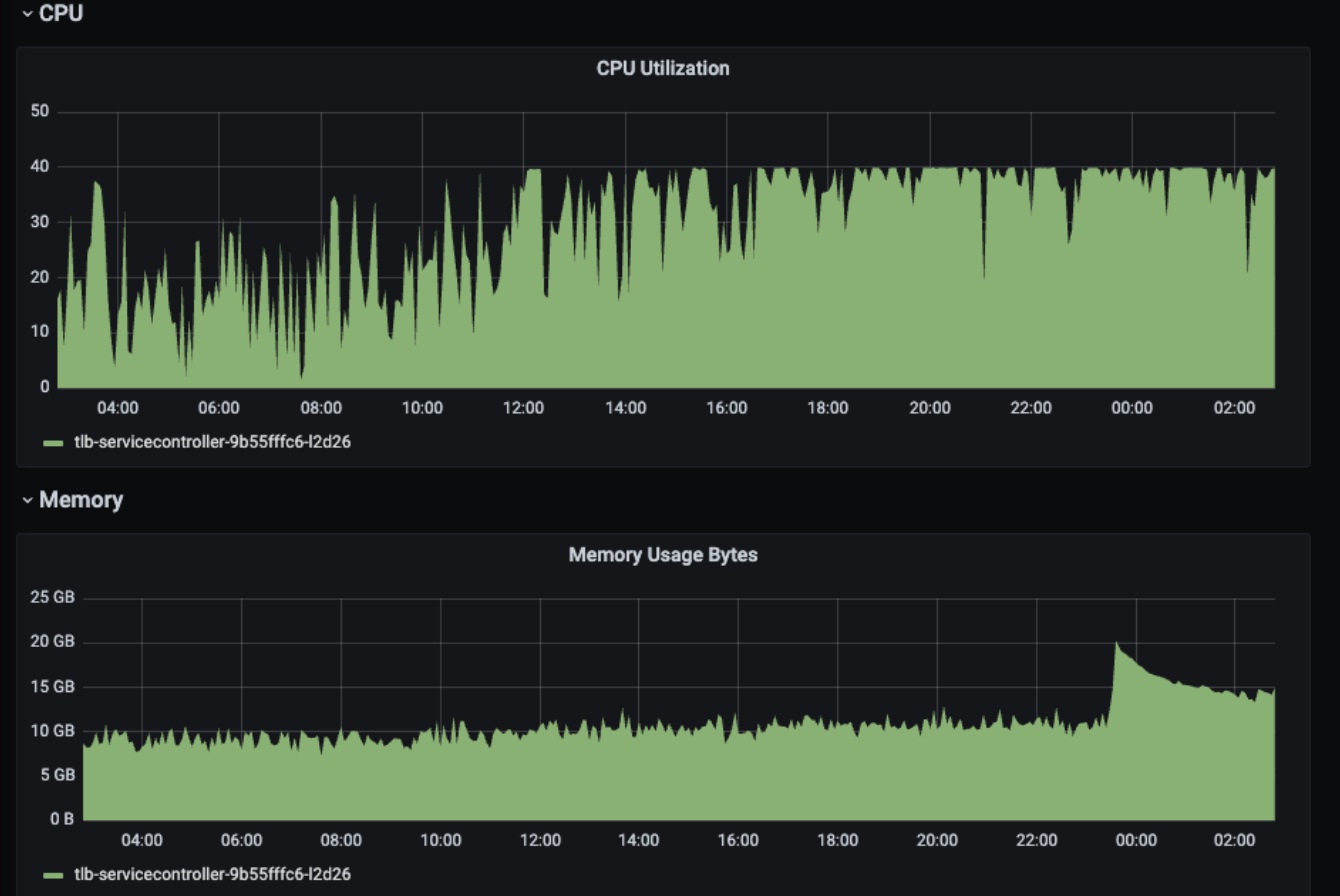
上图是在Prometheus上查看的当前tlb-service-controller在CPU扩容后的CPU和内存分布图。我们可以得出结论,CPU使用率在短短的10分钟内迅速上升至约33,这表明,CPU使用率可能出现了异常。需要进一步调查才能确定原因。
pprof 排查CPU 使用率罪魁祸首
pprof 是一款 Golang 性能剖析工具,可用于分析应用程序的 CPU 和内存占用率等性能问题。pprof 可以在应用程序运行时收集性能数据,然后使用可视化工具进行简单的分析和展示。下面是使用 pprof 对当前 tlb-service-controller 的 CPU 使用率采样生成的分析图。


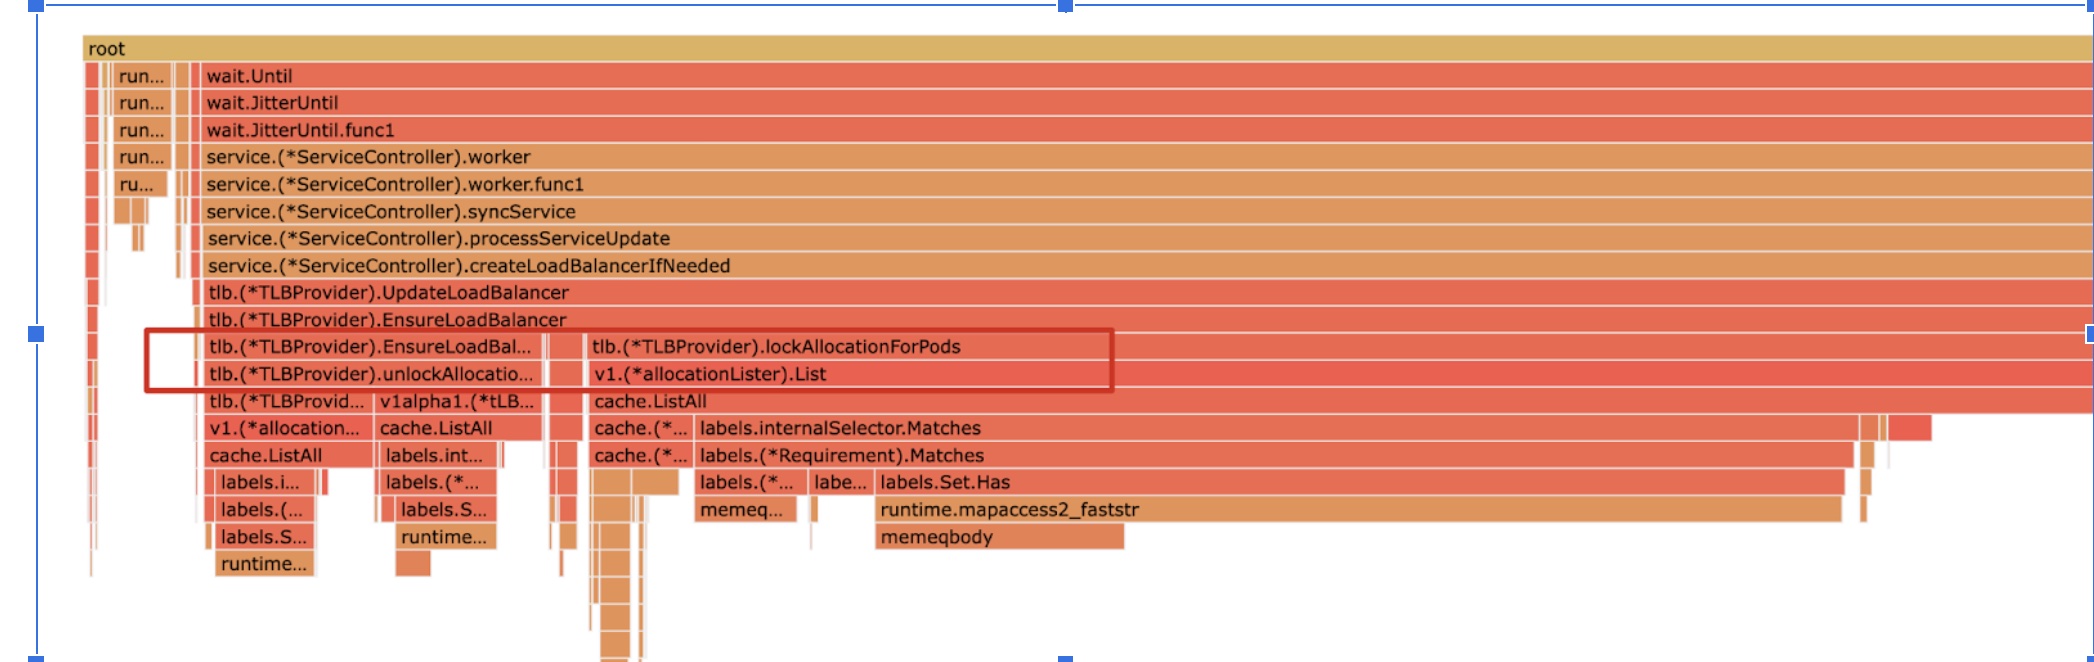
从上面的图中,我们可以看到,主要的罪魁祸首是lockAllocationForPods()和client-go中cache的ListAll()函数。通过查看源代码,我们发现该函数通过client-go提供的标签选择器功能,在每个pod上创建一个标签选择器(labelSelector),找到与之匹配的allocation(读者可以忽略"allocation"的具体含义,它是与IP绑定的资源,每个pod应该对应一个IP)
func (p *TLBProvider) lockAllocationForPods(pods []v1.Pod, service *v1.Service) error {
	if pods == nil {
		return nil
	}
	for _, pod := range pods {
		// Check if allocation already exists for this pod
		labelSelector := labels.Set{
			PodNodeNameLabel:  pod.Spec.NodeName,
			PodNamespaceLabel: pod.Namespace,
			PodNameLabel:      pod.Name,
			PodUIDLabel:       string(pod.UID),
		}.AsSelector()

		allocations, err := p.allocationLister.List(labelSelector)
client-go 中的cache提供的源码分析
client-go 是 Kubernetes 官方提供的 Go 客户端,它提供了丰富的功能,用于操作 Kubernetes API。标签选择器(labelSelector)是 client-go 中的一个重要功能,它可以用于通过标签选择器来过滤 Kubernetes API 响应的对象。client-go 的 cache 是基于 store 实现的。store 提供对 Kubernetes API 对象的访问和操作的统一接口。cache 依赖于 store 来获取 Kubernetes API 对象。
client-go的cache为什么会导致ListAll()函数的 CPU Throttling?为了解决这个问题,我决定查看pprof提示的ListAll()函数的源代码。
func ListAll(store Store, selector labels.Selector, appendFn AppendFunc) error {
	selectAll := selector.Empty()
	for _, m := range store.List() {
		if selectAll {
			// Avoid computing labels of the objects to speed up common flows
			// of listing all objects.
			appendFn(m)
			continue
		}
		metadata, err := meta.Accessor(m)
		if err != nil {
			return err
		}
		if selector.Matches(labels.Set(metadata.GetLabels())) {
			appendFn(m)
		}
	}
	return nil
}
从上面的源码我们可以看出,ListAll()其实是client-go从自己的Store中,使用给定的selector筛选的对象,并将它们附加到给定的列表(appendFn)中。
该函数通过遍历Store中的所有对象,对每个对象执行以下操作:
- 如果给定的selector为空,则跳过标签匹配操作并将对象附加到列表中
- 否则,通过元数据访问器(meta.Accessor),获取对象的元数据,然后将对象的标签转换为标签集,并将该集合与selector进行匹配。如果对象的标签匹配给定的selector,则添加该对象到列表中。
client-go 的 Store 是 client-go 提供的一种抽象的对象缓存机制。它提供了对 Kubernetes API 对象的访问和操作的统一接口。Store 依赖于 store 接口来实现,store 接口定义了 Store 的基本操作,如 List()、Get()、Update() 和 Delete() 等。Store 可以用于存储 Kubernetes API 对象的状态。应用程序可以使用 Store 来获取 Kubernetes API 对象,并监听对象状态的更改。Store 可以提高应用程序的性能,避免频繁地向 Kubernetes API Server 发送请求。
// Store is a generic object storage interface. Reflector knows how to watch a server
// and update a store. A generic store is provided, which allows Reflector to be used
// as a local caching system, and an LRU store, which allows Reflector to work like a
// queue of items yet to be processed.
//
// Store makes no assumptions about stored object identity; it is the responsibility
// of a Store implementation to provide a mechanism to correctly key objects and to
// define the contract for obtaining objects by some arbitrary key type.
type Store interface {
	Add(obj interface{}) error
	Update(obj interface{}) error
	Delete(obj interface{}) error
	List() []interface{}
	ListKeys() []string
	Get(obj interface{}) (item interface{}, exists bool, err error)
	GetByKey(key string) (item interface{}, exists bool, err error)

	// Replace will delete the contents of the store, using instead the
	// given list. Store takes ownership of the list, you should not reference
	// it after calling this function.
	Replace([]interface{}, string) error
	Resync() error
}
分析CPU Throttling 原因
从前面的源码中我们可以看到,ListAll()的主要工作是从 Store中利用golang的for循环在逐一匹配对象是否特定的label,为什么会是 Throttling 的主要原因呢,笔者为此计算了一下当前对应的k8s上的allocation对象的数量
从前面的源代码中,我们可以看出ListAll()的主要任务是在for循环中从Store中逐个匹配对象。为什么会成为CPU Throttling主要原因呢?我计算了当前K8s上的allocation对象数量。
(base)  ~/ k get allocation -A | wc
  145457  436371 15367879
原来有约14.5万个allocation对象。根据前面的代码,对于每个pod,都需要遍历这14.5万个allocation对象。假设每个K8s的service下有100个pod,而每个cluster仅有10个这样的K8s service,操作次数将达到1.45亿次。这些操作都需要在CPU中执行,直接使得该函数成为CPU密集型操作,进而导致了CPU限制。更复杂的情况是,每个cluster的service数量远远超过10个,所以CPU使用率出现了Throttling。
Throttling 解决过程
通过比较Pod和allocation对象,我发现它们之间有一个交叉字段,即IP。因此,可以通过IP将这两个对象关联起来。由于 client-go提供了 添加了自定义 AddIndexers的功能,具体可查看An introduction to Go Kubernetes’ informers 我们可以通过自定义Indexers来加快访问速度,比如下面是一个通过pod的IP而不是name和nameSpace来获取pod的例子
Pod AddIndexers例子
// arbitrary unique name for the new indexer
const ByIP = "IndexByIP"
func podIPIndexFunc(obj interface{}) ([]string, error) {
    pod, ok := obj.(*v1.Pod)
    if !ok {
        return nil, fmt.Errorf("object is not a Pod")
    }

    // Extract the IP addresses from the Pod and return them as a list of strings.
    var ipList []string
    for _, ip := range pod.Status.PodIPs {
        ipList = append(ipList, ip.IP)
    }
    return ipList, nil
}
给informeer添加indexer
podsInformer.AddIndexers(map[string]cache.IndexFunc{ByIP: podIPIndexFunc})
通过给pod的IP来获取pod
items, err := podsInformer.GetIndexer().ByIndex(ByIP, ip)
我仿照上面的方式实现了IpamIndexByIPFunc,并配置了相应的informer。
const (
	IpamIndexByIP        = "IpamIndexByIP"
	Slash32SubnetSize = 32
)

### 实现IpamIndexByIPFunc
func IpamInexByIPFunc(obj interface{}) ([]string, error) {
	alloc, ok := obj.(*ipamv1.Allocation)
	if !ok {
		return nil, fmt.Errorf("object is not a Allocation")
	}

	// Extract the IP addresses from the ipamv1.Allocation and return them as a list of strings.
	var ipList []string
	for _, subNet := range alloc.Status.Subnets {
		if subNet != "" {
			ip, ipNet, err := net.ParseCIDR(subNet)
			if err != nil {
				return nil, fmt.Errorf("failed to parse subnet %s: %s", subNet, err.Error())
			}
			subnetSize, _ := ipNet.Mask.Size()
			if subnetSize == Slash32SubnetSize {
				ipList = append(ipList, ip.String())
			}
		}
	}
	return ipList, nil
}
最后改变lockAllocationForPods()即可
func (p *TLBProvider) lockAllocationForPods(pods []v1.Pod, service *v1.Service) error {
	if pods == nil {
		return nil
	}
	for _, pod := range pods {
alloc:=allocationInformer.Informer().GetIndexer().ByIndex(common.IpamIndexByIP, pod.Status.PodIP)
上述方案需要注意的是,通过AddIndexers添加索引会带来一定的内存消耗。每个索引都需要占用一定的内存空间来存储索引数据结构。索引的内存消耗随着索引的数量、索引字段的数量和索引数据量的增加而增加。在决定是否使用索引时,应该权衡查询性能的提升和额外内存消耗之间的关系,以确保整体系统的性能和可用性。
测试结果
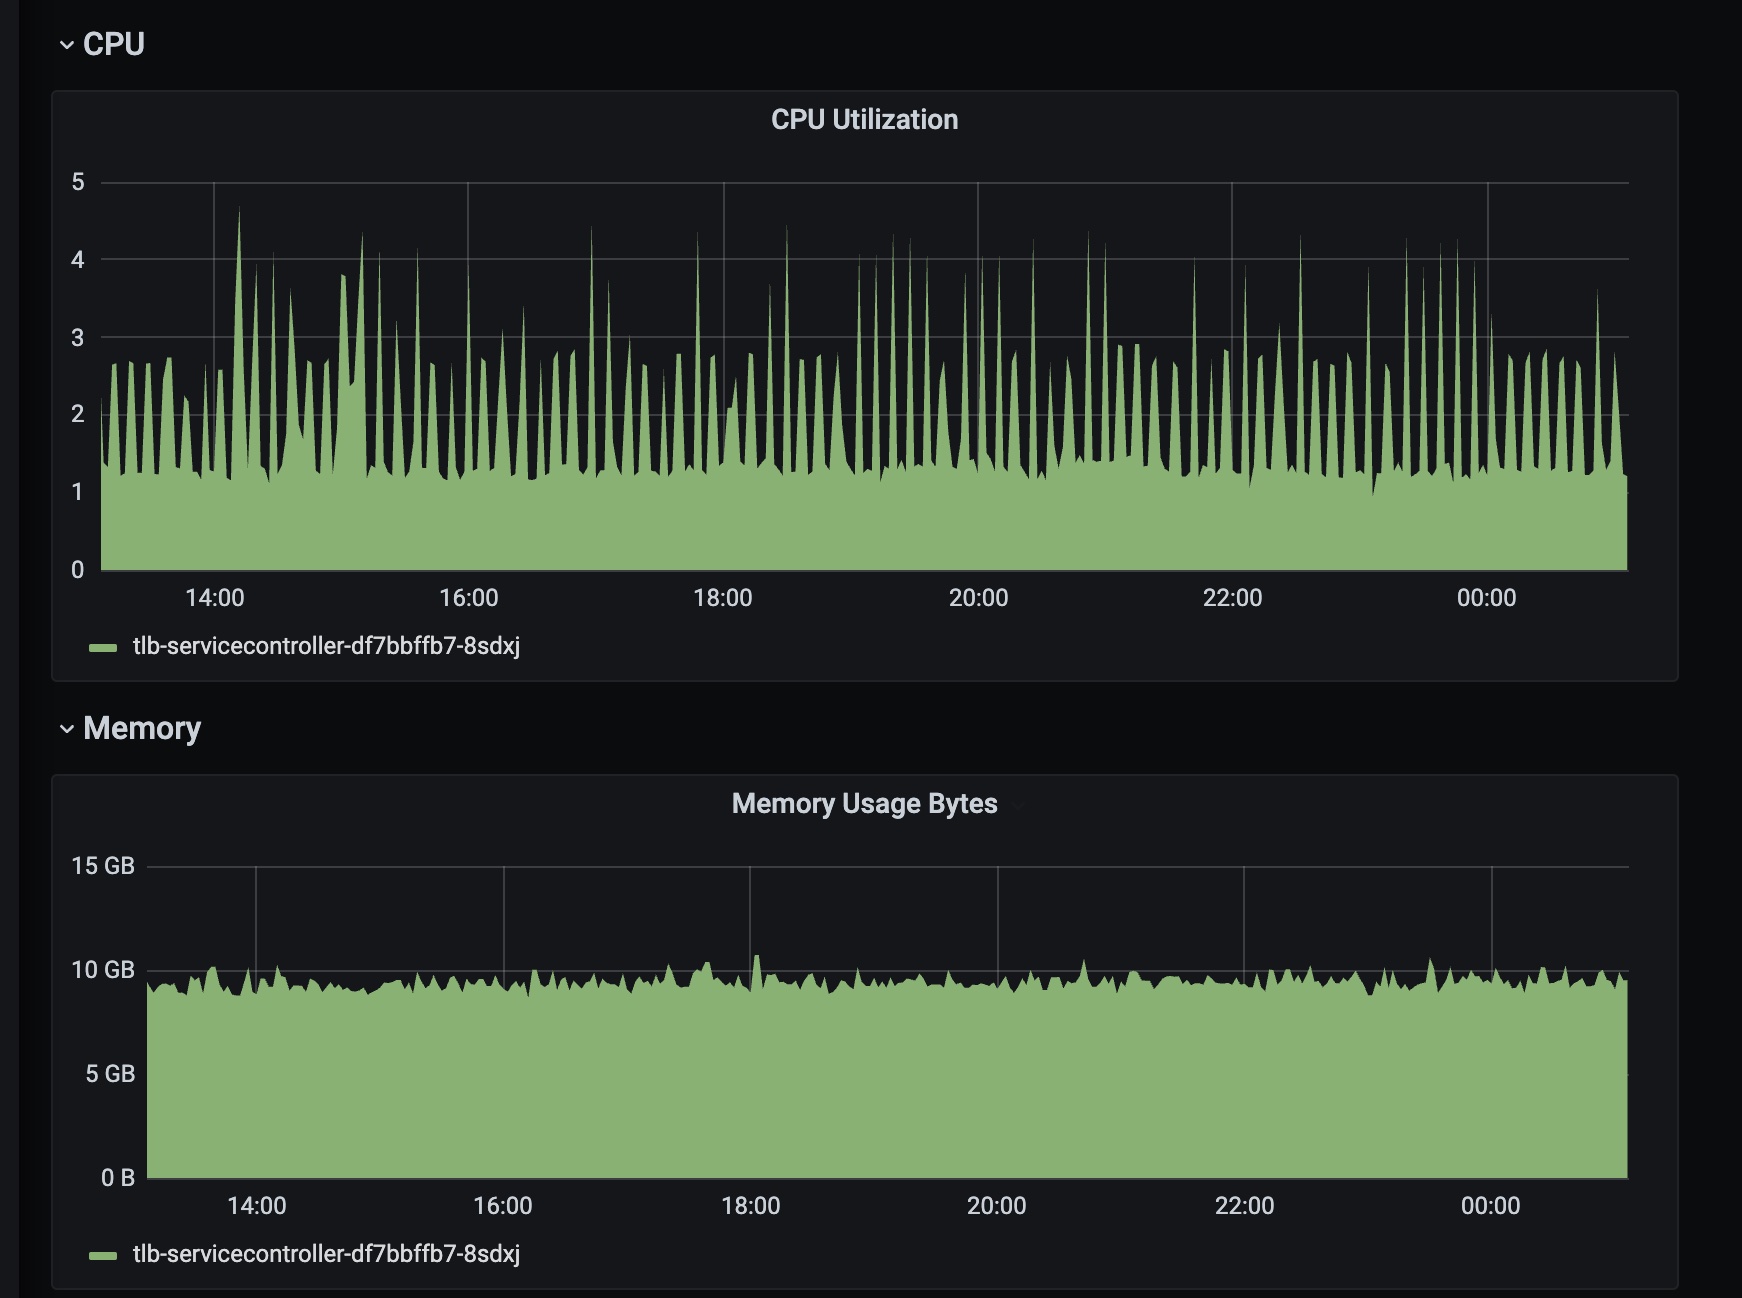
上图是才用了上面的AddIndexers方法后,tlb-service-controller的CPU使用率。我们可以看到,CPU使用率已经稳定在了1~4左右,和之前的40相比的话,性能提升了10倍以上。验证了我们的IpamIndexByIP修复是正确的。同时我们看到内存使用率的没有明显变化,这证明我们通过AddIndexers来通过空间换时间的方法,并不会带来额外的内存消耗。
总结
本文介绍了在Kubernetes中处理CPU Throttling问题的过程。通过使用自定义indexer,加速了对象的访问速度,从而避免了大量的CPU密集型操作,有效提升了系统性能。此次经历让我更深入理解了client-go的使用,以及如何在Kubernetes中解决性能问题。